Chapter 7 Visualise data
7.1 With {ggraph} :
Using the graph_object from previous chapter
graph_object <- igraph::graph_from_data_frame(
  d = G$relationships,
  directed = TRUE,
  vertices = G$nodes
)
plot(graph_object)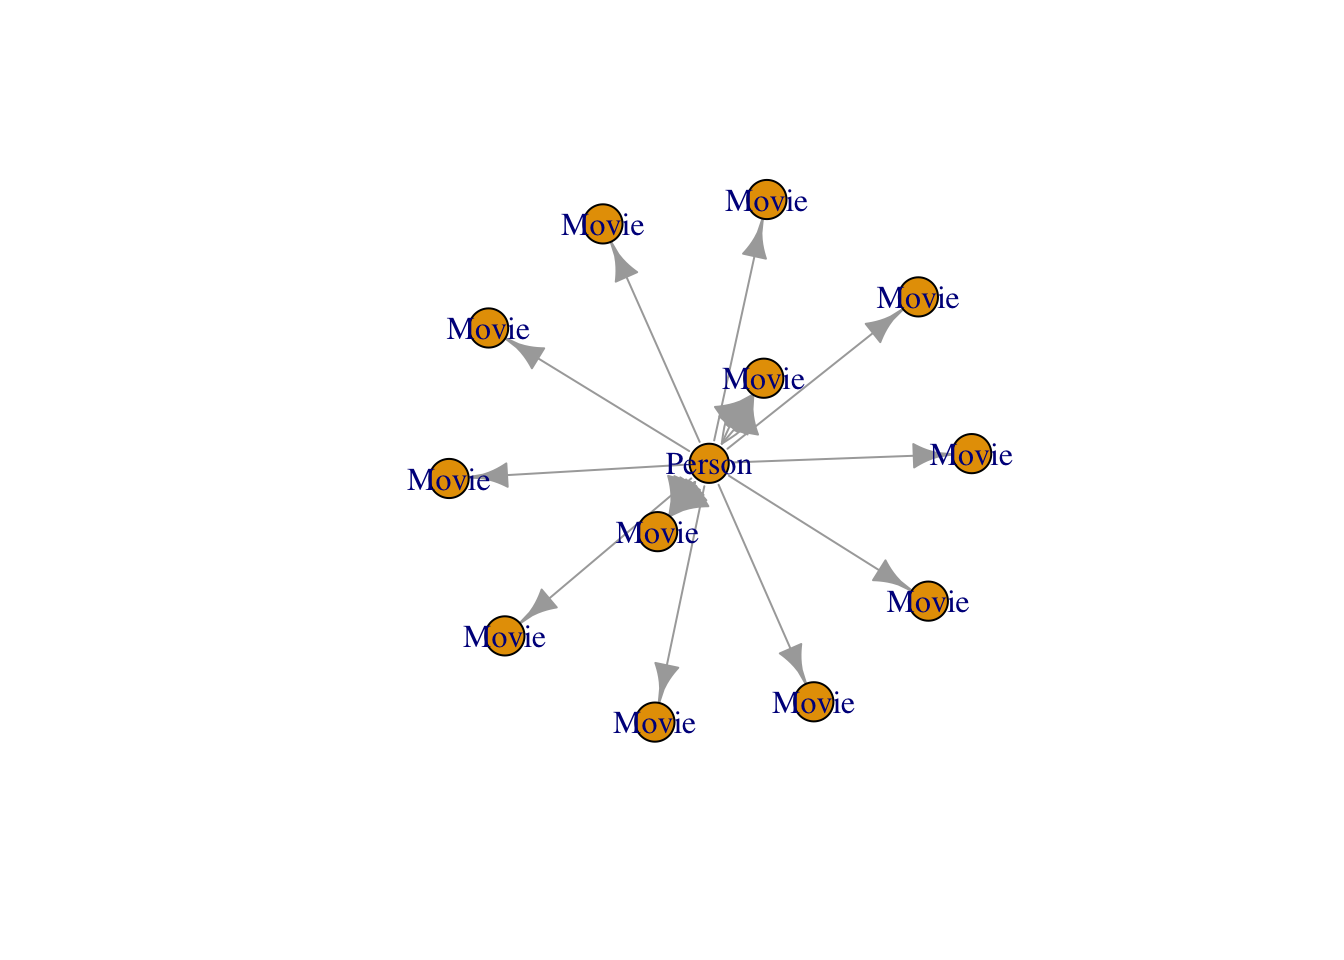
This can also be used with {ggraph} :
library(ggraph)
graph_object %>%
  ggraph() +
  geom_node_label(aes(label = label)) +
  geom_edge_link() +
  theme_graph()
## Using `nicely` as default layout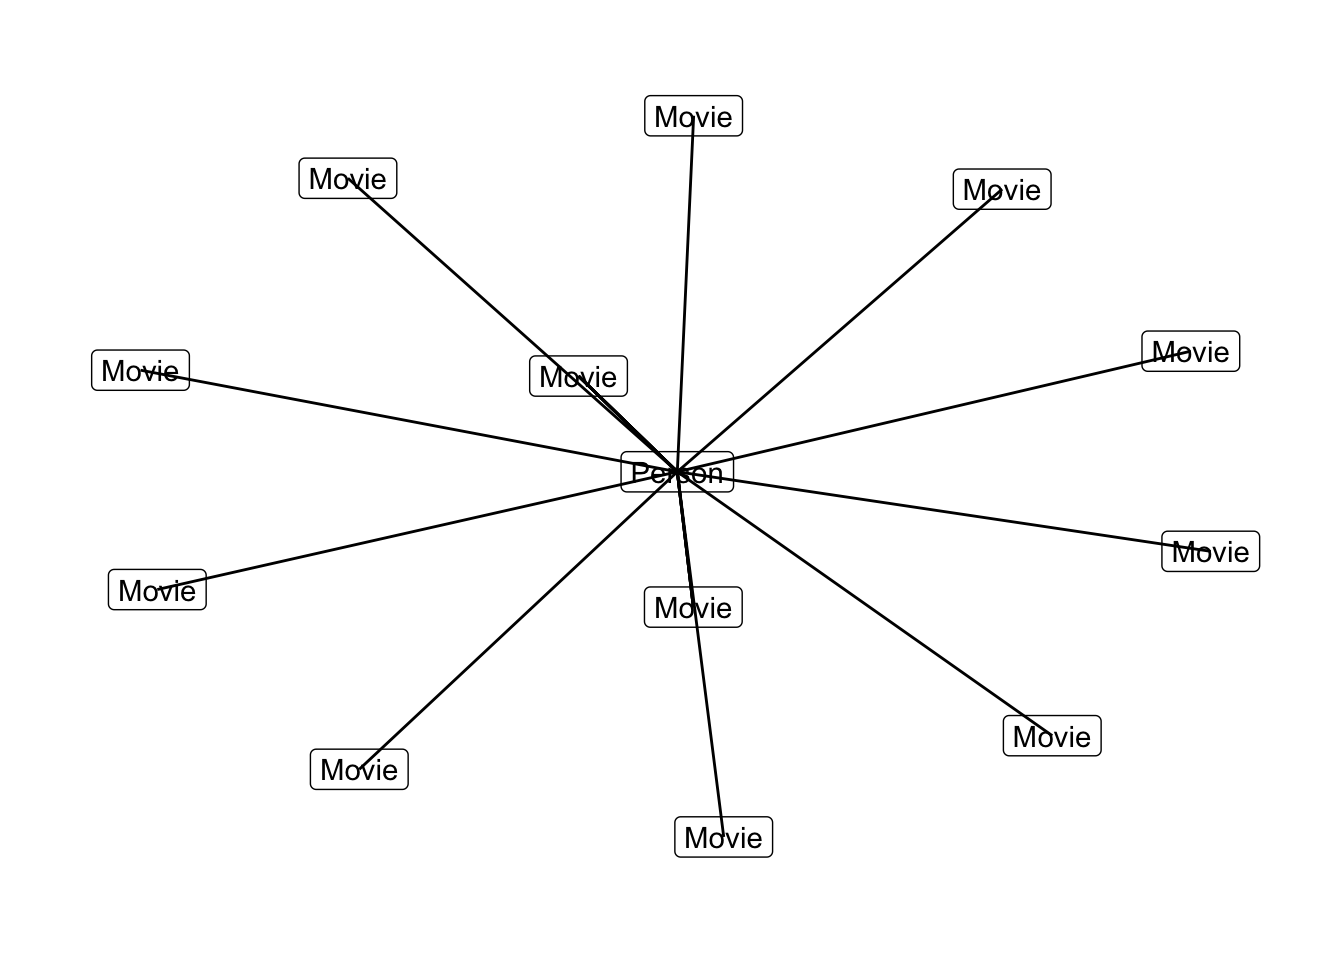
7.2 With {visNetwork}
G <-"MATCH a=(p:Person {name: 'Tom Hanks'})-[r:ACTED_IN]->(m:Movie) RETURN a;" %>%
  call_neo4j(con, type = "graph")

# We'll just unnest the properties
G$nodes <- G$nodes %>%
  unnest_nodes(what = "properties")
head(G$nodes)

# Turn the relationships :
G$relationships <- G$relationships %>%
  unnest_relationships() %>%
  select(from = startNode, to = endNode, label = type)
head(G$relationships)

visNetwork::visNetwork(G$nodes, G$relationships)